Long Beach (WA) Precipitation: Average Monthly Rainfall and Snowfall
This graph shows the average amount of rainfall per month in Long Beach (Washington State). The numbers are calculated over a 30-year period to provide a reliable average.
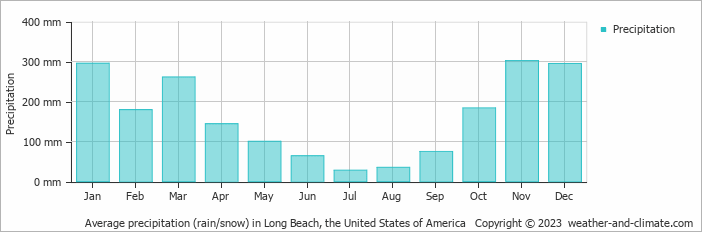
- A lot of rain (rainy season) falls in the months: January, February, March, April, May, October, November and December.
- On average, November is the wettest month with 302 mm of precipitation.
- On average, July is the driest month with 28 mm of precipitation.
- The average amount of annual precipitation is 1961 mm.
Current rainfall in Long Beach (WA)
Fri Nov 22
12°C | 8°C
S  50 km/h
50 km/h9.8 mm
partly cloudy and rain
Sat Nov 23
11°C | 8°C
S 32 km/h
32 km/h24 mm
broken clouds and rain
Sun Nov 24
11°C | 8°C
SE 36 km/h
36 km/h44 mm
overcast and heavy rain


