Bolingbrook (IL) Monthly Rainfall & Precipitation
This page shows both the average monthly rainfall and the number of rainy days in Bolingbrook, Illinois, United States of America. These values are calculated using 30 years of data (1990–2020) to ensure accuracy. Now, let's break down all the details for a clearer picture.
Bolingbrook experiences significant rain/snowfall throughout the year, averaging 1062 mm (42 in) of precipitation annually.
Monthly Rainfall & Rainy Days
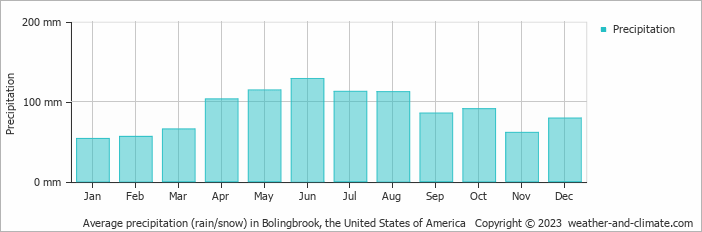
Monthly Precipitation Levels
The average number of days each month with precipitation (> 0.2 mm (0.01 in))
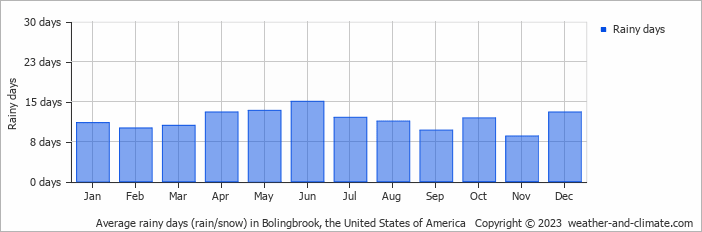
The seasons in Bolingbrook, bring significant changes in precipitation. The wettest month, June, receives high rainfall, with an average of 129 mm (5.1 in) of precipitation. This rainfall is distributed across 15 rainy days.
In contrast, the driest month, January, experiences much less snowfall, totaling 54 mm (2.1 in) over 11 snowy days. These distinct seasonal differences provide diverse experiences throughout the year.June, the wettest month, has a maximum daytime temperature of 27°C (81°F). The city receives 311 hours of sunshine in this period. During the driest month January you can expect a temperature of 0°C (32°F). For more detailed insights into the city's temperatures, visit our Bolingbrook Temperature page.
Annual Rainfall in the United States of America: City Comparison
The map below shows the annual precipitation across the United States of America. You can also select the different months in case you are interested in a specific month.
Bolingbrook vs World: Rainfall Compared
Bolingbrook's average annual precipitation is 1062 mm (42 in). Let's compare this to some popular worldwide tourist destinations:
The city of Rome, Italy, has an average annual precipitation of 832 mm (33 in), spread fairly evenly throughout the year.
In Seoul, South Korea, the average annual precipitation is 1237 mm (49 in), with most rain falling during the summer monsoon season.
Perth, Australia, receives 565 mm (22 in) of rainfall annually, mostly during the winter months.
Mumbai, India, experiences a tropical monsoon climate with 1860 mm (73 in) of annual rainfall, with the majority of precipitation happening during the monsoon season from June to September.
Precipitation amounts are measured using specific gauges installed at weather stations, collecting both rain and snow and any other type of precipitation. Rainfall is measured directly in millimeters, while that from snow and ice is obtained by melting it. Automated systems often incorporate heaters to make this easier.
Information from these stations is transmitted via Wi-Fi, satellite, GPS, or telephone connections to central monitoring networks. This information is immediately updated and integrated into weather models and forecasts.
Climate change is affecting precipitation patterns worldwide, including Bolingbrook (IL):
- Changing Rainfall Patterns: Global warming causes drastic changes in the patterns of rainfall. Some areas have been experiencing increased frequency and intensity of rainfall, while other areas experience longer dry spells or even droughts.
- Local Impacts: Many regions are experiencing heavier rainfall in the winter months and drier, hotter summers. This affects agriculture, water resources, and ecosystems.
- "Ginger" was the longest-lasting Atlantic tropical storm, which spun around the open ocean for 28 days in 1971.
- The world's largest snowflake was recorded in the Guinness Book of Records, at 38 cm (15 inches) wide and 20 cm (7.9 inches) thick. The snowflake fell at Fort Keogh, Montana, USA, on 28 January 1887.
- The greatest snowfall recorded was on Mt. Rainier, Washington State, USA, over 31.5 meters (103 feet) fell during the winter of 1972.
For more detailed information about Bolingbrook (IL)'s weather, including sunshine hours, humidity levels, and temperature data, visit our Bolingbrook (IL) Climate page.
Bolingbrook Weather by Month
Pick a month to see the average temperature, rainfall and sunshine in Bolingbrook - and find the best time to visit.
Bolingbrook 3-Day Forecast
Temperature Rainfall Sunshine Humidity
See the full Bolingbrook climate overview or explore weather in the United States of America.
Popular this month
Where to go in July - average daytime high across popular destinations.
Bucket list
Need travel inspiration? Check out our bucket list articles and be inspired.
 Yosemite National Park is definitely worth a visit
Vast forests, blue lakes, towering sequoias, and majestic waterfalls hint at the beauty of Yosemite National Park—a true natural masterpiece.
The 10 most alternative cities in the United States
Discover the top 10 fun and alternative U.S. cities rich in art, culture, and adventure. From Portland's hippy charm to Sedona's stunning landscapes.
Sedona: Explore Majestic Red Rock Landscapes
A picturesque artists' town surrounded by red rocks and known for its spirituality, vortex energy, and stunning hikes like Cathedral Rock.
10 most idyllic villages to visit in the United States
Discover 10 idyllic villages in the USA, from California to Vermont. Explore their unique charm, rich history, stunning nature, and vibrant arts scenes.