Average monthly snow and rainfall in Bangrak Beach
The mean monthly precipitation over the year in Bangrak Beach (Koh Samui), including rain, snow, hail.
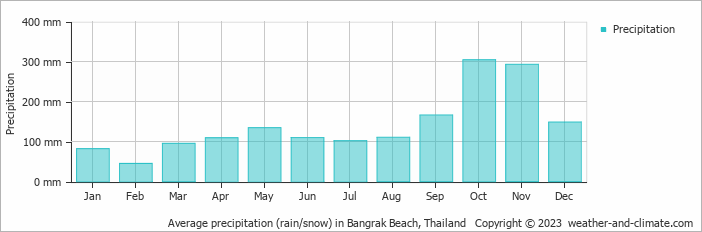
- A lot of rain (rainy season) falls in the months: April, May, June, July, August, September, October, November and December.
- On average, October is the wettest month with 304 mm of precipitation.
- On average, February is the driest month with 45 mm of precipitation.
- The average amount of annual precipitation is 1695 mm.
Weather Forecasts for Bangrak Beach
Sat Apr 27
36°C | 28°C
SE  14 km/h
14 km/h0.5 mm
broken clouds and small chance of slight rain
Sun Apr 28
36°C | 29°C
E 11 km/h
11 km/h0.2 mm
partly cloudy and small chance of slight rain
Mon Apr 29
36°C | 28°C
E 7 km/h
7 km/hbroken clouds and no rain