Santa Cruz de la Sierra Precipitation: Average Monthly Rainfall and Snowfall
This graph shows the average amount of rainfall per month in Santa Cruz de la Sierra (Santa Cruz). The numbers are calculated over a 30-year period to provide a reliable average.
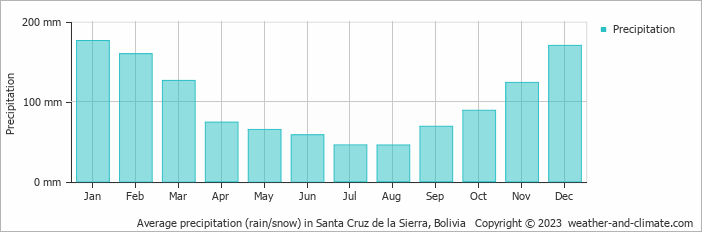
- A lot of rain (rainy season) falls in the months: January, February, March, November and December.
- On average, January is the wettest month with 176 mm of precipitation.
- On average, August is the driest month with 46 mm of precipitation.
- The average amount of annual precipitation is 1201 mm.
Current rainfall in Santa Cruz de la Sierra
Sun Oct 20
32°C | 18°C
NW  25 km/h
25 km/hpartly cloudy and no rain
Mon Oct 21
33°C | 23°C
NW 29 km/h
29 km/h0.7 mm
partly cloudy and chance of rain
Tue Oct 22
30°C | 21°C
NW 18 km/h
18 km/h8.8 mm
broken clouds and rain