Nord Precipitation: Average Monthly Rainfall and Snowfall
This graph shows the average amount of rainfall per month in Nord (). The numbers are calculated over a 30-year period to provide a reliable average.
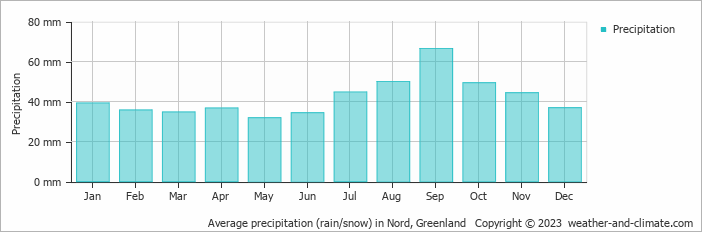
- On average, September is the wettest month with 66 mm of precipitation.
- On average, May is the driest month with 32 mm of precipitation.
- The average amount of annual precipitation is 504 mm.
Current rainfall in Nord
Sun Oct 13
-10°C | -13°C
N  25 km/h
25 km/h11 mm
overcast and snow
Mon Oct 14
-12°C | -16°C
W 14 km/h
14 km/h3.4 mm
overcast and chance of slight snow
Tue Oct 15
-13°C | -16°C
SW 14 km/h
14 km/hbroken clouds and no rain


