Nord Weather & Climate: Best Time to Visit
Average temperatures, rainfall, sunshine and the best time to visit Nord.
Climate overview of Nord
The climate in Nord, Greenland, is marked by large temperature swings across the seasons, ranging from 5°C (41°F) in July to -25°C (-13°F) in March.
The city receives around 504 mm (20 in) of rain/snowfall per year. It experiences a distinct dry season from December to June. September is the wettest month and May the driest.
Nord Weather by Month
Pick a month to see the average temperature, rainfall and sunshine in Nord — and find the best time to visit.
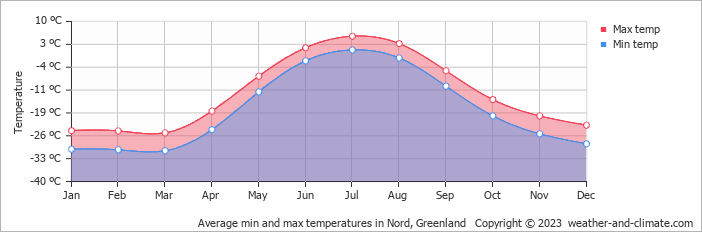
Monthly Temperature in Nord
In Nord, temperatures differ significantly between summer and winter months. On average, daytime temperatures range from a chilly 5°C (41°F) in July to a very cold -25°C (-13°F) in March.
Nighttime temperatures range from 1°C (34°F) in July to -30°C (-22°F) in March.
Check out our detailed temperature page for more information.
Temperature ranges by month
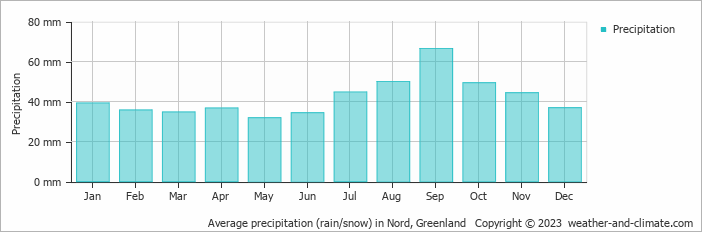
Rainfall in Nord
On average, Nord receives a reasonable amount of rain/snowfall, with an annual precipitation of 504 mm (20 in). The amount of precipitation varies moderately throughout the year. The wettest month, September, sees around 66 mm (2.6 in) of snowfall, perfect for those who enjoy a bit of snow now and then. The driest month, May, still receives a respectable 32 mm (1.3 in) of snowfall. For more details, please visit our Nord Precipitation page.
The mean monthly precipitation over the year, including rain, hail, and snow
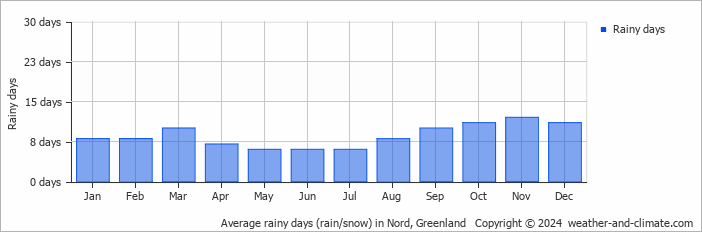
The average number of days each month with precipitation
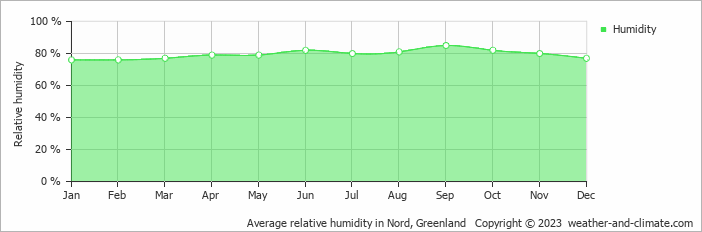
Humidity in Nord by Month
The relative humidity is high throughout the year in Nord.
The city experiences its highest humidity in September, reaching 85%. In January, the humidity drops to its lowest level at 76%. What does this mean? Read our detailed page on humidity levels for further details.
Relative humidity over the year
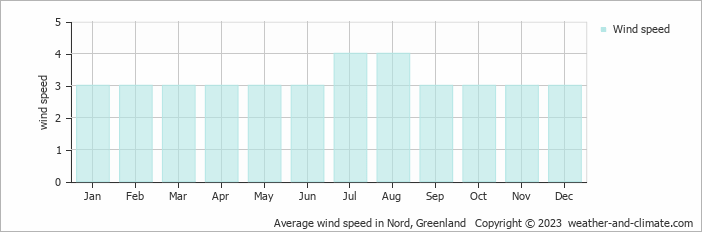
Wind Speed in Nord
The mean wind speed varies between 3 m/s (6 knots) and 4 m/s (8 knots) throughout the year. It is lowest in January, February, March, April, May, June, September, October, November and December and highest during July and August. What does this mean?
The mean monthly wind speed over the year (meters per second)
Best Time to Visit Nord
Frequently asked questions about the climate in Nord
What is the best time to visit Nord?
Nord has a distinct dry season from December to June.
What temperatures can I expect in Nord?
Daytime highs range from -25°C (-13°F) in March to 5°C (41°F) in July. Nighttime lows range from -30°C (-22°F) to 1°C (34°F). Temperatures vary considerably through the year.
How much rain does Nord get?
Annual rainfall is around 504 mm (20 in). September is the wettest month with 66 mm (2.6 in), while May is the driest with 32 mm (1.3 in). In the coldest months, precipitation may fall as snow.
Nord 3-Day Forecast
Nord 3-Day Forecast
Nord on the map
Nord is highlighted — select any city to see its climate.
Popular this month
Where to go in July — average daytime high across popular destinations.
Bucket list
Need travel inspiration? Check out our bucket list articles and be inspired.
