Chelsea Precipitation: Average Monthly Rainfall and Snowfall
This graph shows the average amount of rainfall per month in Chelsea (). The numbers are calculated over a 30-year period to provide a reliable average.
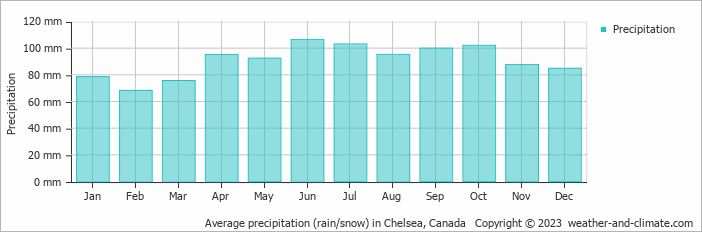
- A lot of rain (rainy season) falls in the months: June, July and October.
- On average, June is the wettest month with 106 mm of precipitation.
- On average, February is the driest month with 68 mm of precipitation.
- The average amount of annual precipitation is 1089 mm.
Current rainfall in Chelsea
Fri Nov 22
6°C | 3°C
NE  22 km/h
22 km/h8 mm
partly cloudy and rain
Sat Nov 23
8°C | 2°C
NW 18 km/h
18 km/hovercast and no rain
Sun Nov 24
4°C | -2°C
NW 22 km/h
22 km/hbroken clouds and no rain