Al Salmiya Precipitation: Average Monthly Rainfall and Snowfall
This graph shows the average amount of rainfall per month in Al Salmiya (). The numbers are calculated over a 30-year period to provide a reliable average.
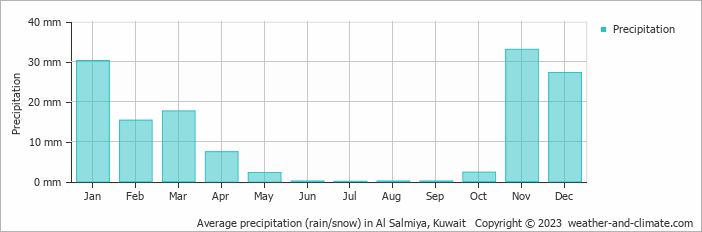
- Al Salmiya has dry periods in February, March, April, May, June, July, August, September and October.
- On average, November is the wettest month with 33 mm of precipitation.
- On average, July is the driest month with 0 mm of precipitation.
- The average amount of annual precipitation is 135 mm.
Current rainfall in Al Salmiya
Sun Dec 15
17°C | 7°C
NW  25 km/h
25 km/hpartly cloudy and no rain
Mon Dec 16
17°C | 7°C
NW 22 km/h
22 km/hclear and no rain
Tue Dec 17
16°C | 7°C
NW 14 km/h
14 km/hbroken clouds and no rain


