Yvonand Sunshine Hours by Month
Sunshine is key to understanding how a place experiences its seasons. This page shows the total number of hours of direct sunlight per month and the average hours per day in Yvonand, Vaud, Switzerland. The figures are based on a 30-year period (1990–2020) to provide a reliable average.
Monthly hours of sunshine
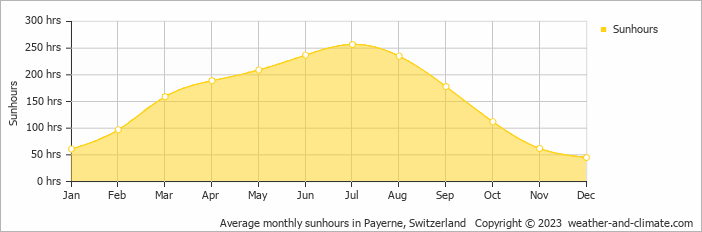
Sunshine in Yvonand varies greatly throughout the year. The sunniest month, July, reaches an impressive 257 hours, while December, the darkest month, offers only 45 hours. The total annual amount of sun is 1841 hours.
Daily hours of sunshine
For those who appreciate different seasons, Yvonand serves as an ideal destination. Expect longer, more sun-filled days in July with an average of 8.6 hours of sunshine daily, and embrace the darker days in December, offering only 1.5 hours of daily sunlight.
Average percent of sunshine
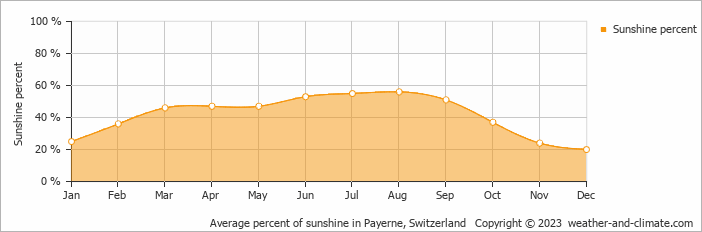
On average the sun shines 56% of the time during the day in August, the highest percentage of any month. December has the lowest percentage at 20%.
Yvonand vs Major Cities: Sunshine Compared
Yvonand enjoys an average of 1841 hours of sunshine annually. Let’s compare this with some popular tourist destinations:
Seville, Spain, enjoys an impressive 2920 hours of sunshine per year, making it an ideal destination even in winter.
In contrast, Tromsø , Norway, receives only about 1270 hours of sunshine per year, known for the polar night with no sunlight for weeks during winter.
In Chicago, USA, the annual sunshine averages 2520 hours, contributing to its humid continental climate.
Melbourne, Australia, has 2380 hours of sunshine annually, with its famous “four seasons in a day” weather pattern.
Related Climate Data for Yvonand
May, Yvonand’s wettest month, receives 118 mm (4.6 in) of rainfall and has a maximum daytime temperature of 19°C (66°F). During the driest month March you can expect a temperature of 11°C (52°F).
For more detailed insights into the city’s temperatures, check out our Temperature page. To explore more about precipitation patterns, visit our Yvonand Precipitation page.