Xico Sunshine Hours by Month
To truly understand a climate, we must look at its sunshine. This page shows the total number of hours of direct sunlight per month and the average hours per day in Xico, Veracruz, Mexico. Long-term data from 1990 to 2020 was used to calculate these averages.
Monthly hours of sunshine
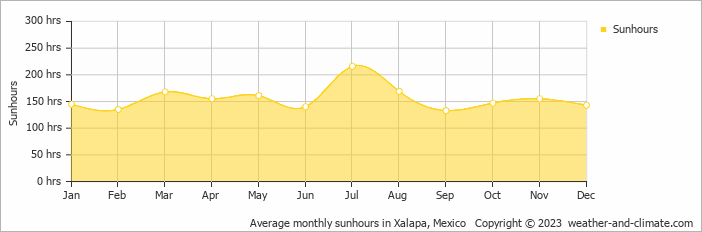
Xico experiences sunny spells throughout the year. The sunniest month, July, sees up to 216 hours of sunshine, while September, the least sunny month, still provides a respectable 133 hours. The total annual sunshine amounts to 1867 hours.
Daily hours of sunshine
The difference in daily sunshine hours between July (7.2 hours per day) and September (4.4 hours per day) offers moderate variety for visitors and residents.
Xico vs Major Cities: Sunshine Compared
Xico enjoys an average of 1867 hours of sunshine annually. Let’s compare this with some popular tourist destinations:
The city of Rome, Italy, experiences 2470 hours of sunshine annually, adding to its charm as a year-round tourist destination.
Manchester, UK, experiences just around 1420 hours of sunshine annually.
Boston, USA, enjoys 2629 hours of sunshine annually, with distinct seasons and many bright, sunny days.
In Brisbane, Australia, the annual sunshine averages 2999 hours, making it one of Australia’s sunniest cities.
Related Climate Data for Xico
September, Xico’s wettest month, receives 178 mm (7 in) of rainfall and has a maximum daytime temperature of 23°C (73°F). During the driest month December you can expect a temperature of 20°C (68°F).
For more detailed insights into the city’s temperatures, check out our Temperature page. To explore more about precipitation patterns, visit our Xico Precipitation page.


