Wichmond Sunshine Hours by Month
The amount of sunshine is fundamental to comprehending a place's climate. This page shows the total number of hours of direct sunlight per month and the average hours per day in Wichmond, Gelderland, Netherlands. This average is based on long-term data collected between 1990 and 2020.
Monthly hours of sunshine
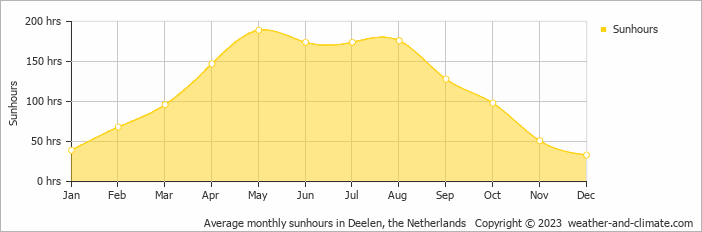
Sunshine in Wichmond varies greatly throughout the year. The sunniest month, May, reaches an impressive 189 hours, while December, the darkest month, offers only 33 hours. The total annual amount of sun is 1373 hours.
Daily hours of sunshine
For those who appreciate different seasons, Wichmond serves as an ideal destination. Expect longer, more sun-filled days in May with an average of 6.3 hours of sunshine daily, and embrace the darker days in December, offering only 1.1 hours of daily sunlight.
Average percent of sunshine
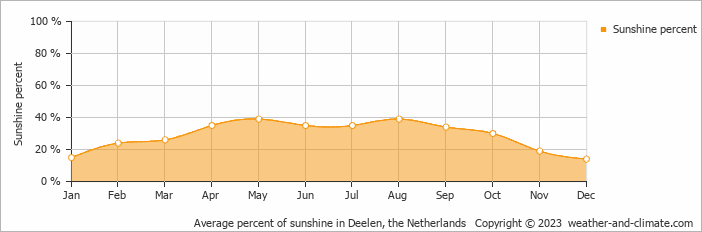
On average the sun shines 39% of the time during the day in May, the highest percentage of any month. December has the lowest percentage at 14%.
Wichmond vs Major Cities: Sunshine Compared
Wichmond enjoys an average of 1373 hours of sunshine annually. Let’s compare this with some popular tourist destinations:
Athens, Greece, enjoys 2769 hours of sunshine each year, making it one of the sunniest destinations in the Mediterranean region.
In contrast, Tromsø , Norway, receives only about 1270 hours of sunshine per year, known for the polar night with no sunlight for weeks during winter.
Osaka, Japan, experiences 2010 hours of sunshine annually, with bright, sunny weather in spring and autumn.
In Brisbane, Australia, the annual sunshine averages 2999 hours, making it one of Australia’s sunniest cities.
Related Climate Data for Wichmond
July, Wichmond’s wettest month, receives 85 mm (3.3 in) of rainfall and has a maximum daytime temperature of 24°C (75°F). During the driest month April you can expect a temperature of 16°C (61°F).
For more detailed insights into the city’s temperatures, check out our Temperature page. To explore more about precipitation patterns, visit our Wichmond Precipitation page.


