Whitton Sunshine Hours by Month
Sunshine is key to understanding how a place experiences its seasons. This page shows the total number of hours of direct sunlight per month and the average hours per day in Whitton, Borders, United Kingdom. These values are calculated using 30 years of data (1990–2020) to ensure accuracy.
Monthly hours of sunshine

Seasonal sunshine in Whitton varies. It peaks at 161 hours in May and drops to 39 hours in January. The total annual amount of sun is 1189 hours.
Daily hours of sunshine
For those who appreciate different seasons, Whitton serves as an ideal destination. Expect longer, more sun-filled days in May with an average of 5.4 hours of sunshine daily, and embrace the darker days in January, offering only 1.3 hours of daily sunlight.
Average percent of sunshine
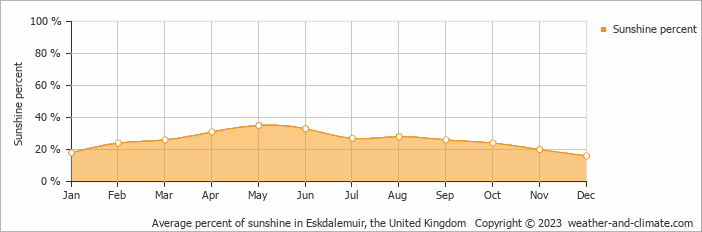
On average the sun shines 35% of the time during the day in May, the highest percentage of any month. December has the lowest percentage at 16%.
Whitton vs Major Cities: Sunshine Compared
Whitton enjoys an average of 1189 hours of sunshine annually. Let’s compare this with some popular tourist destinations:
The city of Rome, Italy, experiences 2470 hours of sunshine annually, adding to its charm as a year-round tourist destination.
In contrast, Juneau, Alaska, receives only about 1523 hours of sunshine per year and is known for its very short days in winter and frequently overcast conditions.
Toronto, Canada, sees around 2071 hours of sunshine each year, with especially long, bright summer days.
Perth, Australia, enjoys 3180 hours of sunshine annually, the highest among major Australian cities.
Related Climate Data for Whitton
August, Whitton’s wettest month, receives 83 mm (3.3 in) of rainfall and has a maximum daytime temperature of 19°C (66°F). During the driest month March you can expect a temperature of 10°C (50°F).
For more detailed insights into the city’s temperatures, check out our Temperature page. To explore more about precipitation patterns, visit our Whitton Precipitation page.


