Silver Sands Sunshine Hours by Month
Sunshine plays a big role in understanding the climate of a city. This page shows the total number of hours of direct sunlight per month and the average hours per day in Silver Sands, Barbados. The numbers reflect climate data gathered over a 30-year period, from 1990 to 2020.
Monthly hours of sunshine
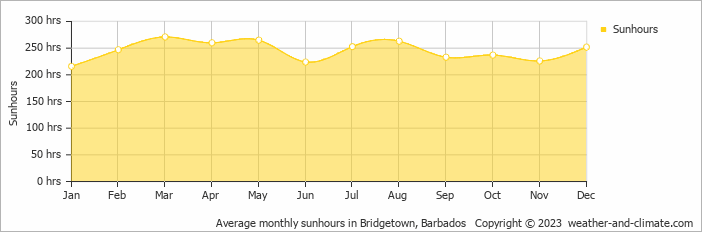
While the amount of sunshine in Silver Sands changes moderately throughout the year, the annual total remains impressive at around 2947 hours. Expect slightly brighter days in March and a subtle dip in January.
Daily hours of sunshine
This means you will experience moderate variation in sunshine hours throughout the year. With 9.0 hours daily sunshine in March, it dips to 7.2 hours in January.
Silver Sands vs Major Cities: Sunshine Compared
Silver Sands enjoys an average of 2947 hours of sunshine annually. Let’s compare this with some popular tourist destinations:
Seville, Spain, enjoys an impressive 2920 hours of sunshine per year, making it an ideal destination even in winter.
In contrast, Brussels, Belgium, receives only about 1590 hours of sunshine per year, known for its frequently overcast and rainy skies.
In Chicago, USA, the annual sunshine averages 2520 hours, contributing to its humid continental climate.
Melbourne, Australia, has 2380 hours of sunshine annually, with its famous “four seasons in a day” weather pattern.
Related Climate Data for Silver Sands
October, Silver Sands’s wettest month, receives 149 mm (5.9 in) of rainfall and has a maximum daytime temperature of 29°C (84°F). During the driest month February you can expect a temperature of 27°C (81°F).
For more detailed insights into the city’s temperatures, check out our Temperature page. To explore more about precipitation patterns, visit our Silver Sands Precipitation page.


