Oakville (ON) Sunshine Hours by Month
In climate discussions, the hours of sunlight reveal much about a location. This page shows the total number of hours of direct sunlight per month and the average hours per day in Oakville, Ontario, Canada. This average is based on long-term data collected between 1990 and 2020.
Monthly hours of sunshine
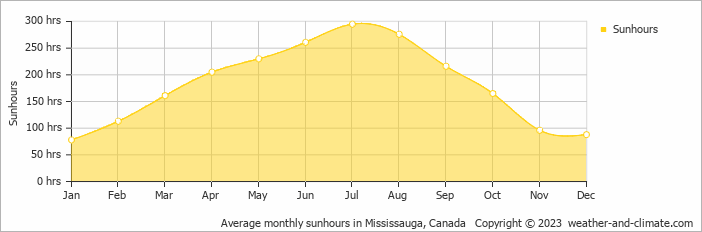
Sunshine in Oakville varies greatly throughout the year. The sunniest month, July, reaches an impressive 295 hours, while January, the darkest month, offers only 78 hours. The total annual amount of sun is 2184 hours.
Daily hours of sunshine
This means the city can be enjoyed more throughout the sunniest month of July under a blue sky, with approximately 9.8 hours of sunshine daily. In contrast, the city experiences much darker days in January, with only 2.6 hours of sunlight per day.
Average percent of sunshine
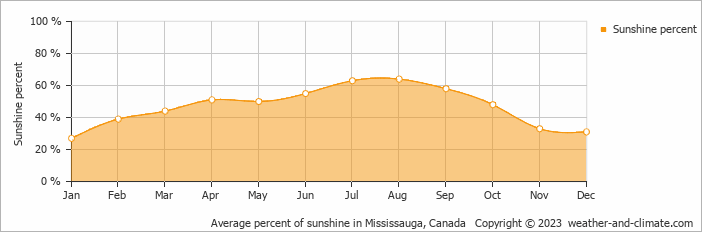
On average the sun shines 64% of the time during the day in August, the highest percentage of any month. January has the lowest percentage at 27%.
Oakville vs Major Cities: Sunshine Compared
Oakville enjoys an average of 2184 hours of sunshine annually. Let’s compare this with some popular tourist destinations:
The city of Rome, Italy, experiences 2470 hours of sunshine annually, adding to its charm as a year-round tourist destination.
Manchester, UK, experiences just around 1420 hours of sunshine annually.
Toronto, Canada, sees around 2071 hours of sunshine each year, with especially long, bright summer days.
Perth, Australia, enjoys 3180 hours of sunshine annually, the highest among major Australian cities.
Related Climate Data for Oakville
April, Oakville’s wettest month, receives 76 mm (3 in) of rainfall and has a maximum daytime temperature of 11°C (52°F). During the driest month August you can expect a temperature of 26°C (79°F).
For more detailed insights into the city’s temperatures, check out our Temperature page. To explore more about precipitation patterns, visit our Oakville Precipitation page.


