Klong Muang Beach Sunshine Hours by Month
Sunshine plays a big role in understanding the climate of a city. This page shows the total number of hours of direct sunlight per month and the average hours per day in Klong Muang Beach, Krabi Province, Thailand. This average is based on long-term data collected between 1990 and 2020.
Monthly hours of sunshine
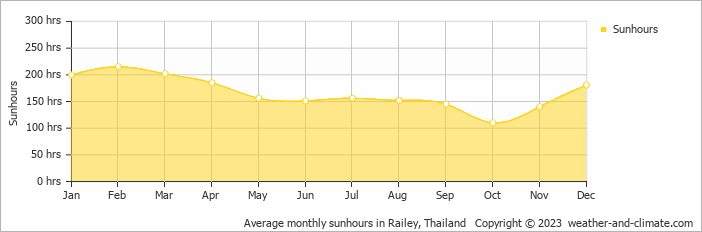
Those who love seasonal contrasts will appreciate Klong Muang Beach. Expect long, bright days with 215 hours in February and darker periods with just 110 hours in October. The total annual amount of sun is 1993 hours.
Daily hours of sunshine
This means the city can be enjoyed more throughout the sunniest month of February under a blue sky, with approximately 7.2 hours of sunshine daily. In contrast, the city experiences much darker days in October, with only 3.7 hours of sunlight per day.
Klong Muang Beach vs Major Cities: Sunshine Compared
Klong Muang Beach enjoys an average of 1993 hours of sunshine annually. Let’s compare this with some popular tourist destinations:
The city of Rome, Italy, experiences 2470 hours of sunshine annually, adding to its charm as a year-round tourist destination.
In contrast, Juneau, Alaska, receives only about 1523 hours of sunshine per year and is known for its very short days in winter and frequently overcast conditions.
Toronto, Canada, sees around 2071 hours of sunshine each year, with especially long, bright summer days.
Adelaide, Australia, enjoys 2770 hours of sunshine annually, with long, sunny summers.
Related Climate Data for Klong Muang Beach
September, Klong Muang Beach’s wettest month, receives 87 mm (3.4 in) of rainfall and has a maximum daytime temperature of 30°C (86°F). During the driest month February you can expect a temperature of 32°C (90°F).
For more detailed insights into the city’s temperatures, check out our Temperature page. To explore more about precipitation patterns, visit our Klong Muang Beach Precipitation page.


