Kinarut Sunshine Hours by Month
The amount of sunshine is fundamental to comprehending a place's climate. This page shows the total number of hours of direct sunlight per month and the average hours per day in Kinarut, Sabah, Malaysia. This average is based on long-term data collected between 1990 and 2020.
Monthly hours of sunshine
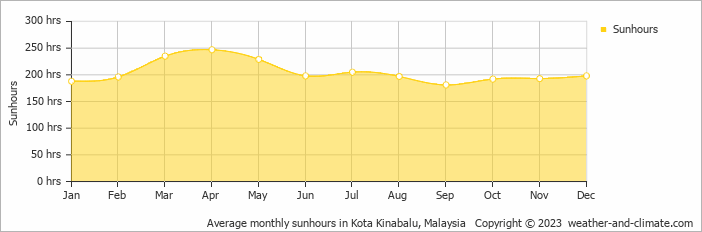
Across the seasons, sunshine hours in Kinarut vary. From a high of 247 hours in April, to a low of 181 hours in September, the city offers a balanced mix of sunny and overcast days. The total annual sunshine amounts to 2459 hours.
Daily hours of sunshine
This means you will experience moderate variation in sunshine hours throughout the year. With 8.2 hours daily sunshine in April, it dips to 6.0 hours in September.
Kinarut vs Major Cities: Sunshine Compared
Kinarut enjoys an average of 2459 hours of sunshine annually. Let’s compare this with some popular tourist destinations:
Athens, Greece, enjoys 2769 hours of sunshine each year, making it one of the sunniest destinations in the Mediterranean region.
In contrast, London, UK, receives only about 1659 hours of sunshine per year, known for its frequently overcast and rainy skies.
Stockholm, Sweden, receives approximately 1907 hours of sunshine annually.
In Tokyo, Japan, the average annual sunshine is 1930 hours, with sunny periods between rainy seasons.
Related Climate Data for Kinarut
October, Kinarut’s wettest month, receives 247 mm (9.7 in) of rainfall and has a maximum daytime temperature of 29°C (84°F). During the driest month March you can expect a temperature of 29°C (84°F).
For more detailed insights into the city’s temperatures, check out our Temperature page. To explore more about precipitation patterns, visit our Kinarut Precipitation page.