Kamperland Sunshine Hours by Month
Sunshine plays a big role in understanding the climate of a city. This page shows the total number of hours of direct sunlight per month and the average hours per day in Kamperland, Zeeland, Netherlands. These values are calculated using 30 years of data (1990–2020) to ensure accuracy.
Monthly hours of sunshine
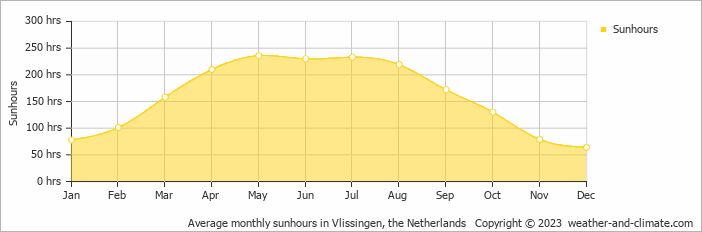
Sunshine in Kamperland varies greatly throughout the year. The sunniest month, May, reaches an impressive 236 hours, while December, the darkest month, offers only 64 hours. The total annual amount of sun is 1910 hours.
Daily hours of sunshine
This means the city can be enjoyed more throughout the sunniest month of May under a blue sky, with approximately 7.9 hours of sunshine daily. In contrast, the city experiences much darker days in December, with only 2.1 hours of sunlight per day.
Average percent of sunshine
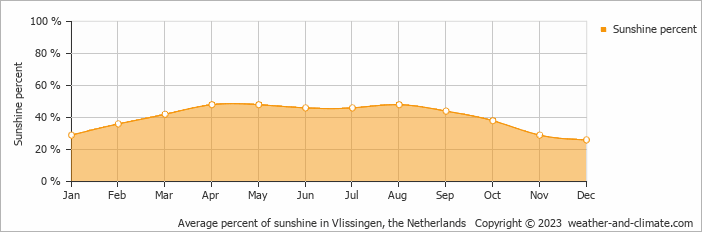
On average the sun shines 48% of the time during the day in April, the highest percentage of any month. December has the lowest percentage at 26%.
Kamperland vs Major Cities: Sunshine Compared
Kamperland enjoys an average of 1910 hours of sunshine annually. Let’s compare this with some popular tourist destinations:
In Barcelona, Spain, there are 2530 hours of sunshine annually and is a city that can be visited year-round.
In contrast, Juneau, Alaska, receives only about 1523 hours of sunshine per year and is known for its very short days in winter and frequently overcast conditions.
The climate in San Francisco, USA, includes 3072 hours of sunshine annually, thanks to its mild coastal weather.
In Tokyo, Japan, the average annual sunshine is 1930 hours, with sunny periods between rainy seasons.
Related Climate Data for Kamperland
December, Kamperland’s wettest month, receives 83 mm (3.3 in) of rainfall and has a maximum daytime temperature of 9°C (48°F). During the driest month April you can expect a temperature of 14°C (57°F).
For more detailed insights into the city’s temperatures, check out our Temperature page. To explore more about precipitation patterns, visit our Kamperland Precipitation page.


