Harlingen Sunshine Hours by Month
In climate discussions, the hours of sunlight reveal much about a location. This page shows the total number of hours of direct sunlight per month and the average hours per day in Harlingen, Friesland, Netherlands. These averages rely on historical data collected over 30 years, from 1990 to 2020.
Monthly hours of sunshine
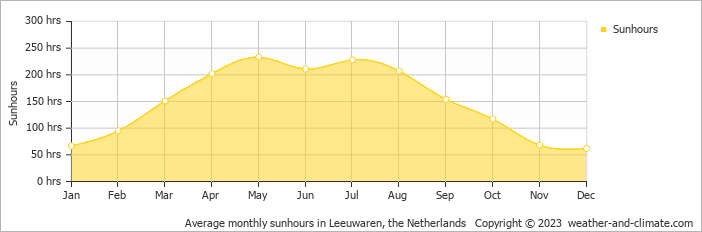
Sunshine in Harlingen varies greatly throughout the year. The sunniest month, May, reaches an impressive 233 hours, while December, the darkest month, offers only 62 hours. The total annual amount of sun is 1795 hours.
Daily hours of sunshine
For those who appreciate different seasons, Harlingen serves as an ideal destination. Expect longer, more sun-filled days in May with an average of 7.8 hours of sunshine daily, and embrace the darker days in December, offering only 2.1 hours of daily sunlight.
Average percent of sunshine
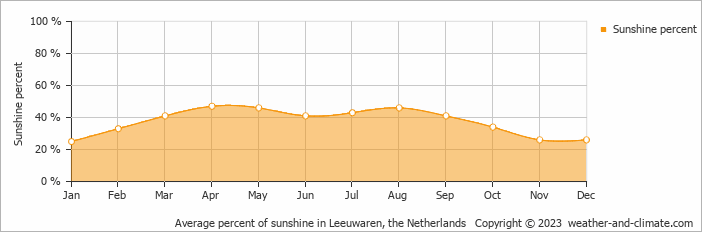
On average the sun shines 47% of the time during the day in April, the highest percentage of any month. January has the lowest percentage at 25%.
Harlingen vs Major Cities: Sunshine Compared
Harlingen enjoys an average of 1795 hours of sunshine annually. Let’s compare this with some popular tourist destinations:
In Lisbon, Portugal, there are approximately 2801 hours of sunshine annually, highlighting its warm and sunny Mediterranean climate.
In contrast, Tromsø , Norway, receives only about 1270 hours of sunshine per year, known for the polar night with no sunlight for weeks during winter.
Stockholm, Sweden, receives approximately 1907 hours of sunshine annually.
Perth, Australia, enjoys 3180 hours of sunshine annually, the highest among major Australian cities.
Related Climate Data for Harlingen
August, Harlingen’s wettest month, receives 112 mm (4.4 in) of rainfall and has a maximum daytime temperature of 21°C (70°F). During the driest month April you can expect a temperature of 11°C (52°F).
For more detailed insights into the city’s temperatures, check out our Temperature page. To explore more about precipitation patterns, visit our Harlingen Precipitation page.


