Gold Coast Sunshine Hours by Month
When exploring climate, sunlight hours tell an important story. This page shows the total number of hours of direct sunlight per month and the average hours per day in Gold Coast, Queensland, Australia. These values are calculated using 30 years of data (1990–2020) to ensure accuracy.
Monthly hours of sunshine
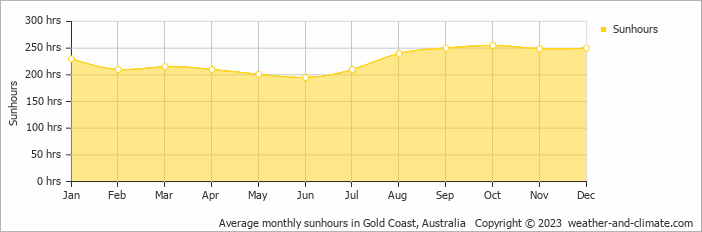
Gold Coast experiences sunny spells throughout the year. The sunniest month, October, sees up to 255 hours of sunshine, while June, the least sunny month, still provides a respectable 195 hours. The total annual sunshine amounts to 2715 hours.
Daily hours of sunshine
This means you can enjoy sunny spells year-round. October sees up to 8.5 hours of daily sunshine, perfect for a sunny trip. June, the least sunny month, still offers a generous 6.5 hours of sun despite this cloudier / rainier time of the year.
Gold Coast vs Major Cities: Sunshine Compared
Gold Coast enjoys an average of 2715 hours of sunshine annually. Let’s compare this with some popular tourist destinations:
Seville, Spain, enjoys an impressive 2920 hours of sunshine per year, making it an ideal destination even in winter.
Manchester, UK, experiences just around 1420 hours of sunshine annually.
In Shanghai, China, the annual average sunshine is 1780 hours, with cloudier weather in summer.
Melbourne, Australia, has 2380 hours of sunshine annually, with its famous “four seasons in a day” weather pattern.
Related Climate Data for Gold Coast
February, Gold Coast’s wettest month, receives 139 mm (5.5 in) of rainfall and has a maximum daytime temperature of 27°C (81°F). During the driest month September you can expect a temperature of 22°C (72°F).
For more detailed insights into the city’s temperatures, check out our Temperature page. To explore more about precipitation patterns, visit our Gold Coast Precipitation page.


