Foxford Sunshine Hours by Month
To truly understand a climate, we must look at its sunshine. This page shows the total number of hours of direct sunlight per month and the average hours per day in Foxford, Mayo, Ireland. These values are calculated using 30 years of data (1990–2020) to ensure accuracy.
Monthly hours of sunshine
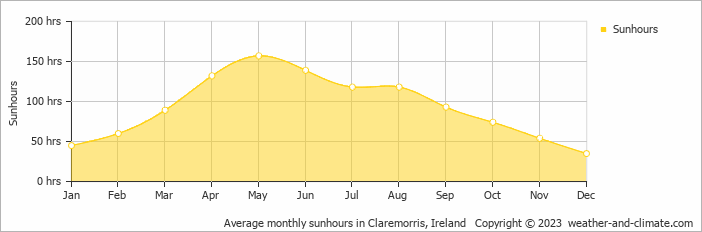
Sunshine in Foxford varies greatly throughout the year. The sunniest month, May, reaches an impressive 157 hours, while December, the darkest month, offers only 35 hours. The total annual amount of sun is 1114 hours.
Daily hours of sunshine
For those who appreciate different seasons, Foxford serves as an ideal destination. Expect longer, more sun-filled days in May with an average of 5.2 hours of sunshine daily, and embrace the darker days in December, offering only 1.2 hours of daily sunlight.
Average percent of sunshine
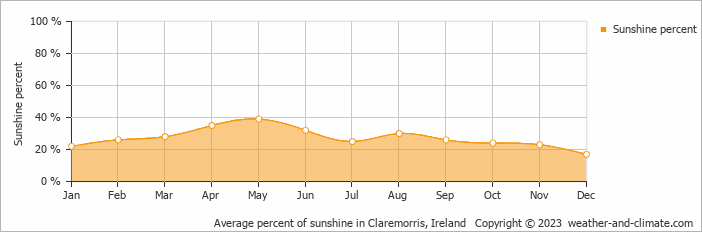
On average the sun shines 39% of the time during the day in May, the highest percentage of any month. December has the lowest percentage at 17%.
Foxford vs Major Cities: Sunshine Compared
Foxford enjoys an average of 1114 hours of sunshine annually. Let’s compare this with some popular tourist destinations:
In Barcelona, Spain, there are 2530 hours of sunshine annually and is a city that can be visited year-round.
In contrast, Juneau, Alaska, receives only about 1523 hours of sunshine per year and is known for its very short days in winter and frequently overcast conditions.
Vancouver, Canada, receives approximately 1940 hours of sunshine annually.
Perth, Australia, enjoys 3180 hours of sunshine annually, the highest among major Australian cities.
Related Climate Data for Foxford
December, Foxford’s wettest month, receives 108 mm (4.3 in) of rainfall and has a maximum daytime temperature of 9°C (48°F). During the driest month April you can expect a temperature of 13°C (55°F).
For more detailed insights into the city’s temperatures, check out our Temperature page. To explore more about precipitation patterns, visit our Foxford Precipitation page.