Clarinbridge Sunshine Hours by Month
In climate discussions, the hours of sunlight reveal much about a location. This page shows the total number of hours of direct sunlight per month and the average hours per day in Clarinbridge, Galway County, Ireland. The figures are based on a 30-year period (1990–2020) to provide a reliable average.
Monthly hours of sunshine
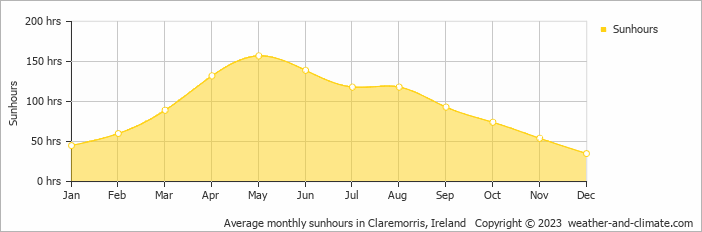
Sunshine in Clarinbridge varies greatly throughout the year. The sunniest month, May, reaches an impressive 157 hours, while December, the darkest month, offers only 35 hours. The total annual amount of sun is 1114 hours.
Daily hours of sunshine
Seasonal changes in sunshine hours are quite obvious in Clarinbridge. While May receives considerable daily sunshine with up to 5.2 hours, December marks the darkest time of the year, where sunshine is scarce with only 1.2 hours of sunlight per day.
Average percent of sunshine
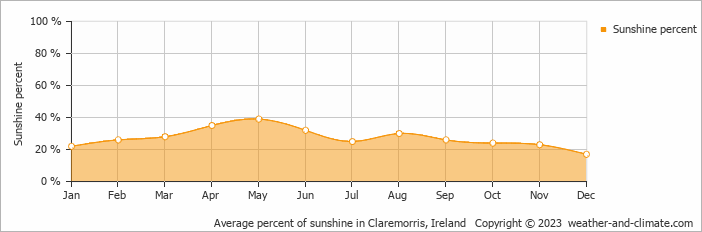
On average the sun shines 39% of the time during the day in May, the highest percentage of any month. December has the lowest percentage at 17%.
Clarinbridge vs Major Cities: Sunshine Compared
Clarinbridge enjoys an average of 1114 hours of sunshine annually. Let’s compare this with some popular tourist destinations:
Athens, Greece, enjoys 2769 hours of sunshine each year, making it one of the sunniest destinations in the Mediterranean region.
In contrast, Juneau, Alaska, receives only about 1523 hours of sunshine per year and is known for its very short days in winter and frequently overcast conditions.
The climate in San Francisco, USA, includes 3072 hours of sunshine annually, thanks to its mild coastal weather.
In Brisbane, Australia, the annual sunshine averages 2999 hours, making it one of Australia’s sunniest cities.
Related Climate Data for Clarinbridge
December, Clarinbridge’s wettest month, receives 93 mm (3.7 in) of rainfall and has a maximum daytime temperature of 10°C (50°F). During the driest month September you can expect a temperature of 18°C (64°F).
For more detailed insights into the city’s temperatures, check out our Temperature page. To explore more about precipitation patterns, visit our Clarinbridge Precipitation page.