Birjand Sunshine Hours by Month
To truly understand a climate, we must look at its sunshine. This page shows the total number of hours of direct sunlight per month and the average hours per day in Birjand, Iran. These values are calculated using 30 years of data (1990–2020) to ensure accuracy.
Monthly hours of sunshine
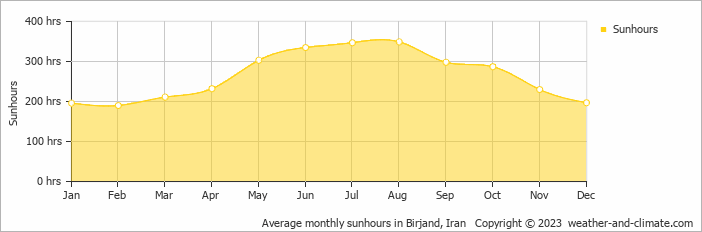
Seasonal sunshine in Birjand varies. It peaks at 349 hours in August and drops to 190 hours in February. The total annual amount of sun is 3175 hours.
Daily hours of sunshine
For those who appreciate different seasons, Birjand serves as an ideal destination. Expect longer, more sun-filled days in August with an average of 11.6 hours of sunshine daily, and embrace the darker days in February, offering only 6.3 hours of daily sunlight.
Birjand vs Major Cities: Sunshine Compared
Birjand enjoys an average of 3175 hours of sunshine annually. Let’s compare this with some popular tourist destinations:
In Lisbon, Portugal, there are approximately 2801 hours of sunshine annually, highlighting its warm and sunny Mediterranean climate.
In contrast, Juneau, Alaska, receives only about 1523 hours of sunshine per year and is known for its very short days in winter and frequently overcast conditions.
In Chicago, USA, the annual sunshine averages 2520 hours, contributing to its humid continental climate.
Adelaide, Australia, enjoys 2770 hours of sunshine annually, with long, sunny summers.
Related Climate Data for Birjand
February, Birjand’s wettest month, receives 0.2 mm (0.01 in) of rainfall and has a maximum daytime temperature of 12°C (54°F). During the driest month July you can expect a temperature of 34°C (93°F).
For more detailed insights into the city’s temperatures, check out our Temperature page. To explore more about precipitation patterns, visit our Birjand Precipitation page.


