Mimana Sunshine Hours by Month
Sunshine is key to understanding how a place experiences its seasons. This page shows the total number of hours of direct sunlight per month and the average hours per day in Mimana, Afghanistan. These averages rely on historical data collected over 30 years, from 1990 to 2020.
Monthly hours of sunshine
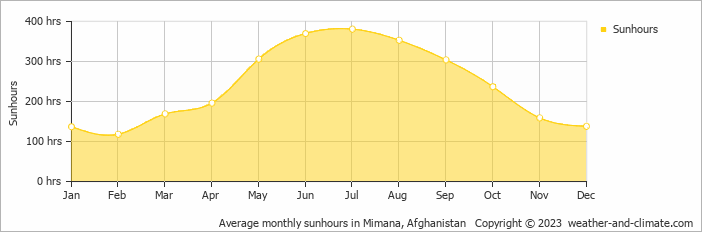
If you're visiting Mimana, timing is key. In July, you can enjoy up to 381 hours of sunshine, while the shorter days of February provide just 118 hours. The total annual amount of sun is 2868 hours.
Daily hours of sunshine
Seasonal changes in sunshine hours are quite obvious in Mimana. While July receives considerable daily sunshine with up to 12.7 hours, February marks the darkest time of the year, where sunshine is scarce with only 3.9 hours of sunlight per day.
Mimana vs Major Cities: Sunshine Compared
Mimana enjoys an average of 2868 hours of sunshine annually. Let’s compare this with some popular tourist destinations:
In Barcelona, Spain, there are 2530 hours of sunshine annually and is a city that can be visited year-round.
Manchester, UK, experiences just around 1420 hours of sunshine annually.
Beijing, China, has 2505 hours of sunshine annually, with clear, sunny days in winter.
In Brisbane, Australia, the annual sunshine averages 2999 hours, making it one of Australia’s sunniest cities.
Related Climate Data for Mimana
March, Mimana’s wettest month, receives 0.7 mm (0.03 in) of rainfall and has a maximum daytime temperature of 14°C (57°F). During the driest month August you can expect a temperature of 31°C (88°F).
For more detailed insights into the city’s temperatures, check out our Temperature page. To explore more about precipitation patterns, visit our Mimana Precipitation page.


