Grenada Sunshine Hours by Month
When exploring climate, sunlight hours tell an important story. This page shows the total number of hours of direct sunlight per month and the average hours per day in Grenada, Grenada. The numbers reflect climate data gathered over a 30-year period, from 1990 to 2020.
Monthly hours of sunshine
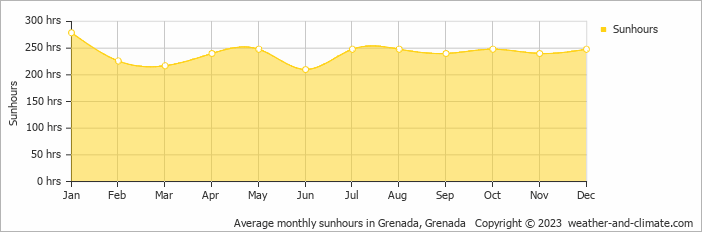
Across the seasons, sunshine hours in Grenada vary. From a high of 279 hours in January, to a low of 210 hours in June, the city offers a balanced mix of sunny and overcast days. The total annual sunshine amounts to 2892 hours.
Daily hours of sunshine
This means you will experience moderate variation in sunshine hours throughout the year. With 9.3 hours daily sunshine in January, it dips to 7.0 hours in June.
Grenada vs Major Cities: Sunshine Compared
Grenada enjoys an average of 2892 hours of sunshine annually. Let’s compare this with some popular tourist destinations:
In Lisbon, Portugal, there are approximately 2801 hours of sunshine annually, highlighting its warm and sunny Mediterranean climate.
In contrast, Reykjavík, Iceland, receives only about 1330 hours of sunshine per year, known for its frequently overcast and rainy skies.
In Seoul, South Korea, there are approximately 2133 hours of sunshine per year, mostly during spring and autumn.
In Brisbane, Australia, the annual sunshine averages 2999 hours, making it one of Australia’s sunniest cities.
Related Climate Data for Grenada
October, Grenada’s wettest month, receives 159 mm (6.3 in) of rainfall and has a maximum daytime temperature of 29°C (84°F). During the driest month February you can expect a temperature of 28°C (82°F).
For more detailed insights into the city’s temperatures, check out our Temperature page. To explore more about precipitation patterns, visit our Grenada Precipitation page.


