Average monthly wind speed in Westerland
Here you can view the typical wind conditions throughout the year in Westerland, (Noord-Holland), the Netherlands.
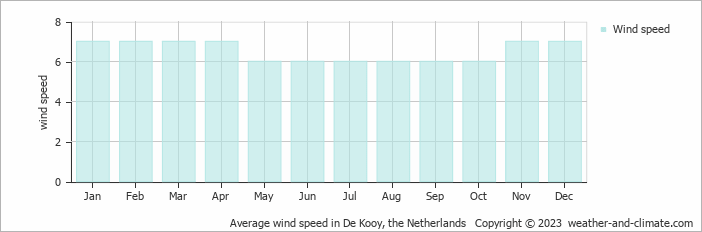
The average annual wind speed in Westerland spans from 6 m/s (12 knots) to 7 m/s (14 knots).
The average wind speed is 6 m/s (12 knots) in May, June, July, August, September and October, which is rather windy. This means that on most days, and for many hours each day, the wind blows at a moderate level. There may still be stronger gusts or calmer moments, but windy conditions are typical during this period. You will generally feel large tree branches swaying and hear the wind whistling around buildings.
This average equates to approximately 22 km/h or 13 mph. Under these conditions, using umbrellas is usually not advisable. Most outdoor events must plan according to the wind, as it could be a significantly breezy day. Activities like walking, running, or cycling would involve noticeable wind resistance, which might become tiring over time.
The windiest period, January, February, March, April, November and December has average wind speeds of 7 m/s (14 knots). This means typical days feature strong gusts that create resistance when walking and make large trees sway noticeably. Wind becomes a constant factor. The speed translates to 25.2 kilometers per hour or 15.7 miles per hour. While intensity varies throughout the day, consistently strong winds are the norm.
For more detailed information about Westerland’s weather, including monthly rainfall, sunshine hours, and humidity levels, visit our Westerland climate page.


