Average monthly wind speed in Schijndel
On this page you will find more information about the mean monthly wind speed over the year in Schijndel (Noord-Brabant), the Netherlands.
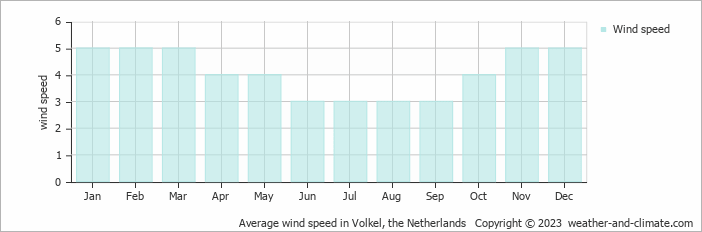
Annually, wind speeds in Schijndel vary between 3 m/s (6 knots) at their lowest and 5 m/s (10 knots) at their peak.
With an average wind speed of 3 m/s (6 knots) in June, July, August and September, it experiences a fair and typical breeze. However, conditions can vary between days, and stronger winds may occasionally occur. On a day with 3 m/s (6 knots), leaves and small twigs are constantly in motion, and a flag would be clearly waving. This translates to roughly 11 km/h or 6.7 mph. Most days are suitable for spending time outdoors.
Wind speeds average 5 m/s (10 knots) in , marking the windiest months of the year. The air is often steady and noticeable throughout the month, though occasional stronger gusts or brief calms may occur. Windy conditions are typical during this period, making it a great time for activities like windsurfing and kitesurfing.
For more detailed information about Schijndel’s weather, including monthly rainfall, sunshine hours, and humidity levels, visit our Schijndel climate page.


