Average monthly wind speed in Nieuwpoort
Here you can view the typical wind conditions throughout the year in Nieuwpoort, (West-Flanders), Belgium.
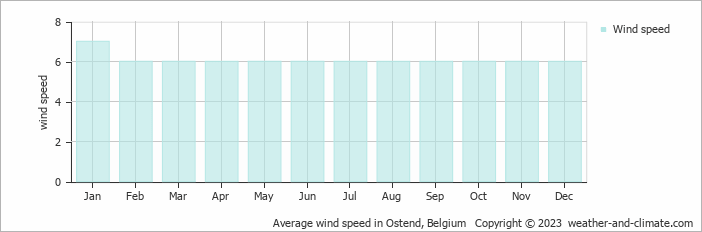
Annually, wind speeds in Nieuwpoort vary between 6 m/s (12 knots) at their lowest and 7 m/s (14 knots) at their peak.
According to our statistical data you will experience an average wind speed of 6 m/s (12 knots) during February, March, April, May, June, July, August, September, October, November and December, creating consistently windy conditions. Most days bring steady air movement, with occasional calmer or gustier spells. At this speed, large tree branches sway clearly, and wind noise is often audible near buildings.
This equals about 22 kilometers per hour or 13 miles per hour. Umbrellas are generally ineffective, and strong wind may influence how enjoyable or practical some activities feel. Cyclists and runners can expect noticeable resistance, making physical effort more demanding over time.
The windiest period, January has average wind speeds of 7 m/s (14 knots). This means typical days feature strong gusts that create resistance when walking and make large trees sway noticeably. Wind becomes a constant factor. The speed translates to 25.2 kilometers per hour or 15.7 miles per hour. While intensity varies throughout the day, consistently strong winds are the norm.
For more detailed information about Nieuwpoort’s weather, including monthly rainfall, sunshine hours, and humidity levels, visit our Nieuwpoort climate page.


