Average monthly wind speed in Maxwell Hill
On this page you will find more information about the mean monthly wind speed over the year in Maxwell Hill (), Barbados.
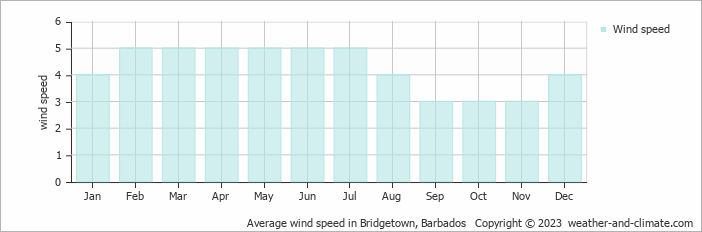
Wind speed in Maxwell Hill varies across the year, ranging from 3 m/s (6 knots) to 5 m/s (10 knots).
The average wind speed is 3 m/s (6 knots) during September, October and November, indicating consistent yet manageable airflow. Daily conditions vary, with some days bringing stronger breezes. At the average speed, foliage moves steadily, and flags show noticeable motion. In common units, this equals about 11 kilometers per hour or 6.7 miles per hour. Overall, it's are pleasant months to be outdoors in terms of wind conditions.
Wind speeds average 5 m/s (10 knots) during February, March, April, May, June and July, making these the windiest months of the year. Most days bring strong winds that can sway small trees and make walking more challenging. Umbrellas are difficult to manage. The average speed of 5 m/s equals 18 km/h or 11.2 mph. While calmer intervals or stronger gusts may occur, breezy conditions are typical throughout this period. It's generally a great time for flying a kite or going windsurfing.
For more detailed information about Maxwell Hill’s weather, including monthly rainfall, sunshine hours, and humidity levels, visit our Maxwell Hill climate page.


