Average monthly wind speed in Mariahout
On this page you will find more information about the mean monthly wind speed over the year in Mariahout (Noord-Brabant), the Netherlands.
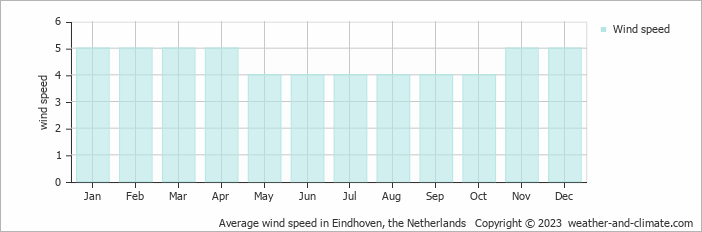
Annually, wind speeds in Mariahout vary between 4 m/s (8 knots) at their lowest and 5 m/s (10 knots) at their peak.
The 4 m/s (8 knots) average in May, June, July, August, September and October means Mariahout experiences consistent moderate winds. Conditions vary from calm periods around to more active episodes throughout the month. At typical wind levels, smaller trees show steady branch movement. In common units, 4 m/s (8 knots) equals 14.4 km/h or 8.9 mph. While generally comfortable for most activities, occasional windy days may affect your plans and can make the air feel cooler.
Wind speeds average 5 m/s (10 knots) during January, February, March, April, November and December, making these the windiest months of the year. Most days bring strong winds that can sway small trees and make walking more challenging. Umbrellas are difficult to manage. The average speed of 5 m/s equals 18 km/h or 11.2 mph. While calmer intervals or stronger gusts may occur, breezy conditions are typical throughout this period. It's generally a great time for flying a kite or going windsurfing.
For more detailed information about Mariahout’s weather, including monthly rainfall, sunshine hours, and humidity levels, visit our Mariahout climate page.


