Average monthly wind speed in Kilburn
The mean monthly wind speed over the year in Kilburn (), the United Kingdom.
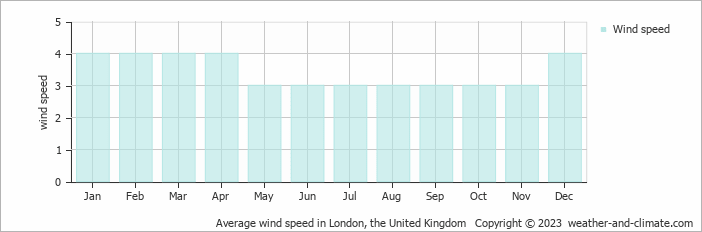
Wind speed in Kilburn varies across the year, ranging from 3 m/s (6 knots) to 4 m/s (8 knots).
The average wind speed is 3 m/s (6 knots) during May, June, July, August, September, October and November, indicating consistent yet manageable airflow. Daily conditions vary, with some days bringing stronger breezes. At the average speed, foliage moves steadily, and flags show noticeable motion. In common units, this equals about 11 kilometers per hour or 6.7 miles per hour. Overall, it's are pleasant months to be outdoors in terms of wind conditions.
Wind speeds reach an average of 4 m/s (8 knots) in January, February, March, April and December; this is the windiest time of the year. This means that on some days, the air is a strong breeze. There may still be stronger gusts or calmer moments, but windy conditions are the norm during this month.
For more detailed information about Kilburn’s weather, including monthly rainfall, sunshine hours, and humidity levels, visit our Kilburn climate page.


