Average monthly wind speed in Cromvoirt
Here you can view the typical wind conditions throughout the year in Cromvoirt, (), the Netherlands.
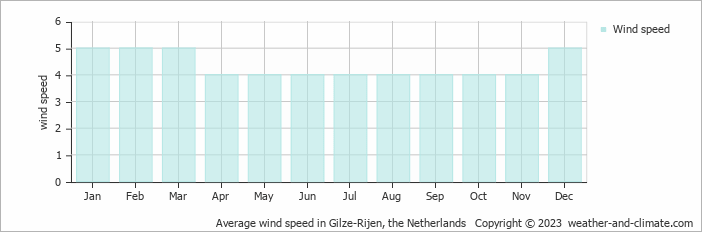
Annually, wind speeds in Cromvoirt vary between 4 m/s (8 knots) at their lowest and 5 m/s (10 knots) at their peak.
During April, May, June, July, August, September, October and November, wind speed averages 4 m/s (8 knots), creating notably breezy conditions. Daily fluctuations span from gentle winds to more substantial gusts. At the average speed of 4 m/s (8 knots), small tree branches show continuous swaying motion. This wind strength equals 14.4 kilometers per hour or 8.9 miles per hour. Most plans remain feasible, though some days bring conditions strong enough to affect certain sports.
However, January, February, March and December experiences average wind speeds of [5 m/s]. This means most days feature persistent breezes that cause large branches to sway and dust to blow around. The wind creates noticeable resistance. This speed translates to 18 kilometers per hour or 11.2 miles per hour. While intensity may vary at times, consistently windy weather is typical during this period. It's an ideal time for kite and windsurfing enthusiasts.
For more detailed information about Cromvoirt’s weather, including monthly rainfall, sunshine hours, and humidity levels, visit our Cromvoirt climate page.


