Average monthly wind speed in Ban Thung Pong
Here you can view the typical wind conditions throughout the year in Ban Thung Pong, (), Thailand.
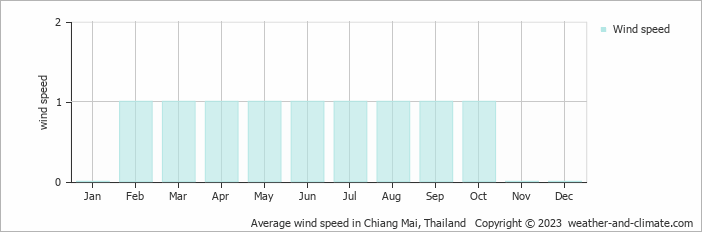
Data from: Chiang Mai, Thailand (12 KM, 7 Miles).
The average annual wind speed in Ban Thung Pong spans from () to 1 m/s (2 knots).
Wind speeds reach an average of 1 m/s (2 knots) in February, March, April, May, June, July, August, September and October. This means that on some days, the air is mostly very light. Some days there will be no wind, but others may see quite light breezes up to 3 m/s (6 knots).
For more detailed information about Ban Thung Pong’s weather, including monthly rainfall, sunshine hours, and humidity levels, visit our Ban Thung Pong climate page.


