Average monthly wind speed in Ban Bang Muang
The mean monthly wind speed over the year in Ban Bang Muang (Nonthaburi Province), Thailand.
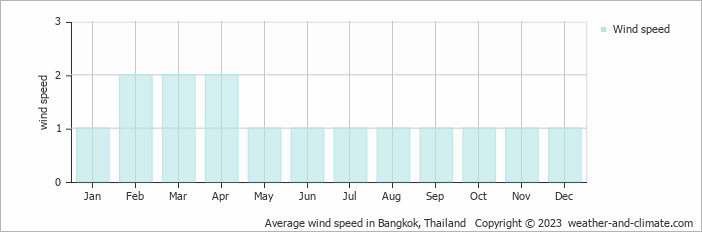
Annually, wind speeds in Ban Bang Muang vary between 1 m/s (2 knots) at their lowest and 2 m/s (4 knots) at their peak.
An average speed of 1 m/s (2 knots) in January, May, June, July, August, September, October, November and December would indicate that the air is mostly very light. Some days there will be no wind, but others may see quite light breezes up to 3 m/s (6 knots). With this average on most days you'd rarely feel the air move on your skin. This light, harmless air movements translates to around 3.6 kilometers per hour or 2.2 miles per hour.
On the Beaufort scale, it is referred to as "light air." Smoke would tend to rise vertically or drift only slightly. Most days would not be windy enough to rustle the leaves, though there could be other periods of breezy conditions. This average wind speed results in pleasant and calm weather.
The windiest period, February, March and April has average wind speeds of 2 m/s (4 knots). This means typical days have gentle air flow that moves leaves occasionally. Wind is noticeable but not strong. The speed translates to 7.2 kilometers per hour or 4.5 miles per hour. While some days feel almost still, others may see stronger periods reaching 4 m/s (8 knots).
For more detailed information about Ban Bang Muang’s weather, including monthly rainfall, sunshine hours, and humidity levels, visit our Ban Bang Muang climate page.


