Monthly Average Rainy days in Zandvoort
The number of days each month with rain, snow and hail in Zandvoort (Noord-Holland), the Netherlands.
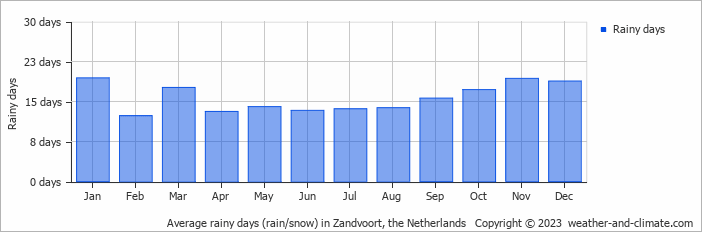
- Most rainy days are in January, March, September, October, November and December.
- On average, January is the most rainy with 19 days of rain/snow.
- On average, February is the driest month with 12 rainy days.
- The average annual number of rainy days is 188.
Current rainfall in Zandvoort
Thu Dec 26
9°C | 6°C
S  2 m/s
2 m/s
2 m/sbroken clouds and no rain
Fri Dec 27
7°C | 5°C
SE 2 m/s
2 m/sovercast and no rain
Sat Dec 28
6°C | 4°C
W 4 m/s
4 m/s1.2 mm
overcast and small chance of rain


