Monthly Average Rainy days in Xilinji
The number of days each month with rain, snow and hail in Xilinji (), China.
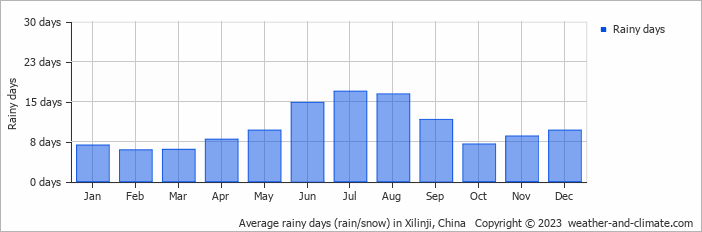
- Most rainy days are in July and August.
- On average, July is the most rainy with 16 days of rain/snow.
- On average, February is the driest month with 5 rainy days.
- The average annual number of rainy days is 120.
Current rainfall in Xilinji
Sun Dec 22
-9°C | -24°C
NW  3 m/s
3 m/s
3 m/salmost clear and no rain
Mon Dec 23
-9°C | -26°C
W 2 m/s
2 m/salmost clear and no rain
Tue Dec 24
-14°C | -29°C
S 1 m/s
1 m/s0.7 mm
broken clouds and small chance of slight snow


