Monthly Average Rainy days in Xichang
The number of days each month with rain, snow and hail in Xichang (Sichuan), China.
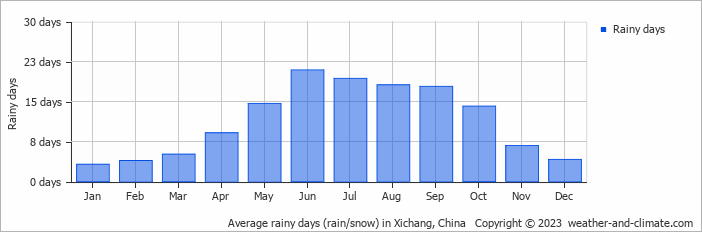
- Most rainy days are in June, July, August and September.
- On average, June is the most rainy with 20 days of rain/snow.
- On average, January is the driest month with 3 rainy days.
- The average annual number of rainy days is 136.
Current rainfall in Xichang
Sun Dec 22
18°C | 8°C
S  2 m/s
2 m/s
2 m/s0.3 mm
partly cloudy and small chance of slight rain
Mon Dec 23
18°C | 6°C
SW 2 m/s
2 m/sclear and no rain
Tue Dec 24
19°C | 7°C
SW 2 m/s
2 m/sclear and no rain


