Monthly Average Rainy days in Woodburn (OR)
The number of days each month with rain, snow and hail in Woodburn (Oregon), the United States of America.
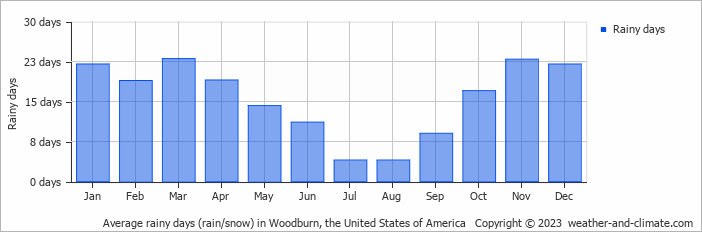
- Most rainy days are in January, February, March, April, October, November and December.
- On average, March is the most rainy with 23 days of rain/snow.
- On average, July is the driest month with 4 rainy days.
- The average annual number of rainy days is 187.
Current rainfall in Woodburn (OR)
Sat Nov 23
9°C | 5°C
S  18 km/h
18 km/h6.6 mm
partly cloudy and slight rain
Sun Nov 24
8°C | 5°C
N 11 km/h
11 km/h25 mm
overcast and heavy rain
Mon Nov 25
10°C | 6°C
S 7 km/h
7 km/h3.2 mm
broken clouds and slight rain


