Monthly Average Rainy days in Wilsonville (OR)
The number of days each month with rain, snow and hail in Wilsonville (Oregon), the United States of America.
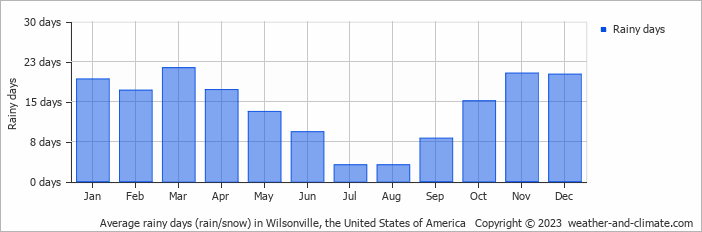
- Most rainy days are in January, February, March, April, October, November and December.
- On average, March is the most rainy with 21 days of rain/snow.
- On average, July is the driest month with 3 rainy days.
- The average annual number of rainy days is 167.
Current rainfall in Wilsonville (OR)
Sat Dec 28
11°C | 7°C
SW  5 m/s
5 m/s
5 m/s7.6 mm
broken clouds and rain
Sun Dec 29
9°C | 5°C
SW 6 m/s
6 m/s12 mm
broken clouds and rain
Mon Dec 30
8°C | 4°C
S 3 m/s
3 m/s0.9 mm
broken clouds and chance of slight rain


