ClimateForecastMayJune >>

Average monthly rainy days in Wheeling (IL)

The number of days each month with rain, snow and hail in Wheeling (Illinois), the United States of America.

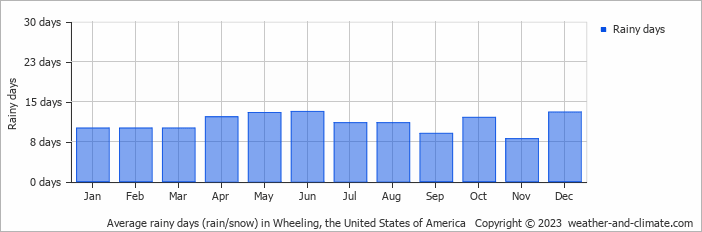
  • On average, June is the most rainy with 13 days of rain/snow.
  • On average, November is the driest month with 8 rainy days.
  • The average annual number of rainy days is 132.

Forecast for Wheeling (IL)

Mon   May 06
20°C | 7°C
E 14 km/h
almost clear and no rain

almost clear and no rain

Tue   May 07
23°C | 12°C
SW 22 km/h
11 mm
broken clouds and thunder

broken clouds and thunder

Wed   May 08
24°C | 11°C
SW 14 km/h
5.7 mm
broken clouds and small chance of slight rain

broken clouds and small chance of slight rain

Interested in more climate information?

This site provides you with all the information you need about the climate in Wheeling.

Our site offers climate and forecast data for every country in the world. Are you going to the United States of America? On this website you can find historical weather averages for many cities in the United States of America. Not sure yet where to go? We now have a tool which recommends destinations that suit your ideal climate conditions. Find out where to go with our weather planner.