ClimateForecastMayJune >>

Average monthly rainy days in West Wittering

The number of days each month with rain, snow and hail in West Wittering (West Sussex), the United Kingdom.

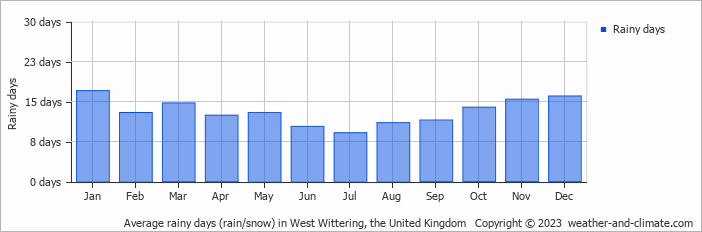
  • Most rainy days are in January, November and December.
  • On average, January is the most rainy with 17 days of rain/snow.
  • On average, July is the driest month with 9 rainy days.
  • The average annual number of rainy days is 157.

Forecast for West Wittering

Thu   May 16
16°C | 10°C
SW 11 km/h
8.3 mm
broken clouds and rain

broken clouds and rain

Fri   May 17
18°C | 8°C
E 11 km/h
0.2 mm
broken clouds and small chance of slight rain

broken clouds and small chance of slight rain

Sat   May 18
19°C | 11°C
E 11 km/h
11 mm
broken clouds and rain

broken clouds and rain

Interested in more climate information?

This site provides you with all the information you need about the climate in West Wittering.

Our site offers climate and forecast data for every country in the world. Are you going to the United Kingdom? On this website you can find historical weather averages for many cities in the United Kingdom. Not sure yet where to go? We now have a tool which recommends destinations that suit your ideal climate conditions. Find out where to go with our weather planner.