Monthly Average Rainy days in Webster (NY)
The number of days each month with rain, snow and hail in Webster (New York State), the United States of America.
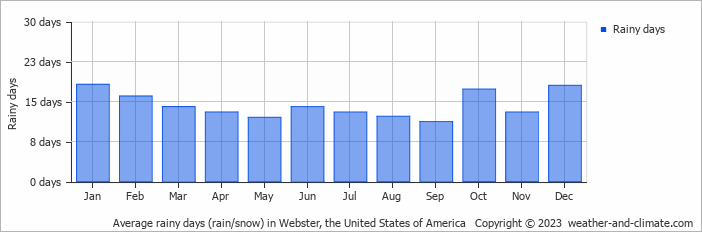
- Most rainy days are in January, February, October and December.
- On average, January is the most rainy with 18 days of rain/snow.
- On average, September is the driest month with 11 rainy days.
- The average annual number of rainy days is 171.
Current rainfall in Webster (NY)
Sun Nov 24
7°C | 2°C
W  25 km/h
25 km/hbroken clouds and no rain
Mon Nov 25
9°C | -1°C
E 14 km/h
14 km/h1.7 mm
overcast and small chance of slight rain
Tue Nov 26
11°C | 0°C
W 32 km/h
32 km/h6.4 mm
partly cloudy and slight rain


