ClimateForecastMayJune >>

Average monthly rainy days in Warwick (RI)

The number of days each month with rain, snow and hail in Warwick (Rhode Island), the United States of America.

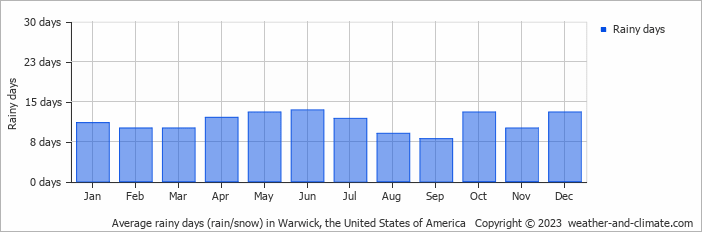
  • On average, June is the most rainy with 13 days of rain/snow.
  • On average, September is the driest month with 8 rainy days.
  • The average annual number of rainy days is 134.

Weather Forecasts for Warwick (RI)

Fri   May 03
16°C | 8°C
NE 25 km/h
broken clouds and no rain

broken clouds and no rain

Sat   May 04
15°C | 7°C
E 22 km/h
partly cloudy and no rain

partly cloudy and no rain

Sun   May 05
12°C | 7°C
S 22 km/h
1.3 mm
overcast and  chance of slight rain

overcast and chance of slight rain

Interested in more climate information?

Weather and Climate provides you with all the information you need about the climate in Warwick.

Our site offers climate and forecast data for every country in the world. Are you going to the United States of America? On this website you can find historical weather averages for many cities in the United States of America. Not sure yet where to go? We now have a tool which recommends destinations that suit your ideal climate conditions. Find out where to go with our weather planner.