Monthly Average Rainy days in Warren (VT)
The number of days each month with rain, snow and hail in Warren (Vermont), the United States of America.
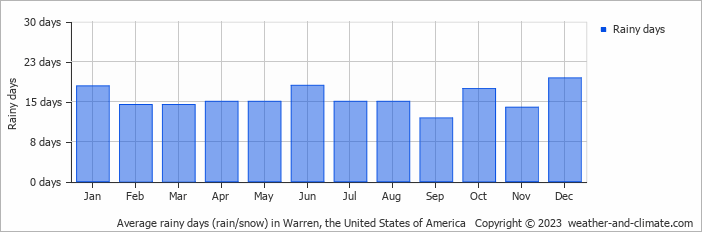
- Most rainy days are in January, April, May, June, July, August, October and December.
- On average, December is the most rainy with 19 days of rain/snow.
- On average, September is the driest month with 11 rainy days.
- The average annual number of rainy days is 187.
Current rainfall in Warren (VT)
Mon Dec 23
-7°C | -22°C
S  3 m/s
3 m/s
3 m/s4.8 mm
partly cloudy and small chance of rain
Tue Dec 24
-3°C | -9°C
SW 3 m/s
3 m/s18 mm
overcast and snow
Wed Dec 25
-5°C | -12°C
N 1 m/s
1 m/salmost clear and no rain


