Monthly Average Rainy days in Warminster
The number of days each month with rain, snow and hail in Warminster (Wiltshire), the United Kingdom.
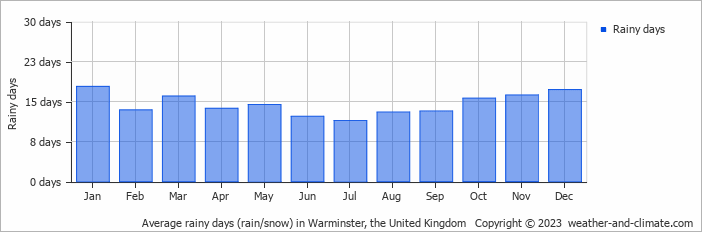
- Most rainy days are in January, March, October, November and December.
- On average, January is the most rainy with 17 days of rain/snow.
- On average, July is the driest month with 11 rainy days.
- The average annual number of rainy days is 174.
Current rainfall in Warminster
Tue Dec 03
7°C | 1°C
E  4 km/h
4 km/hpartly cloudy and no rain
Wed Dec 04
11°C | 1°C
S 18 km/h
18 km/h3.8 mm
broken clouds and no rain
Thu Dec 05
12°C | 7°C
W 29 km/h
29 km/h12 mm
overcast and heavy rain


