Average monthly rainy days in Wangen an der Aare (BERN)

The number of days each month with rain, snow and hail in Wangen an der Aare (Canton of Bern), Switzerland.

Average monthly rainy days in Wangen an der Aare (BERN),

Feel free to add this climate graph to your website. Click the copy button above.

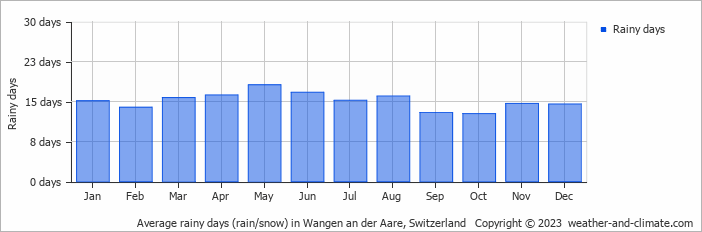
  • Most rainy days are in January, March, April, May, June, July and August.
  • On average, May is the most rainy with 18 days of rain/snow.
  • On average, October is the driest month with 12 rainy days.
  • The average annual number of rainy days is 181.

Weather Forecasts for Wangen an der Aare (BERN)

Fri   Mar 29
17°C | 0°C
E 7 km/h
0.8 mm
broken clouds and  chance of rain

broken clouds and chance of rain

Sat   Mar 30
19°C | 4°C
NW 14 km/h
6.3 mm
broken clouds and thunder

broken clouds and thunder

Sun   Mar 31
17°C | 3°C
NE 7 km/h
2 mm
broken clouds and  chance of slight rain

broken clouds and chance of slight rain

Interested in more climate information?

Weather and Climate provides you with all the information you need about the climate in Wangen an der Aare.

Our site offers climate and forecast data for every country in the world. Are you going to Switzerland? On this website you can find historical weather averages for many cities in Switzerland. Not sure yet where to go? We now have a tool which recommends destinations that suit your ideal climate conditions. Find out where to go with our weather planner.