Monthly Average Rainy days in Wangcang
The number of days each month with rain, snow and hail in Wangcang (Sichuan), China.
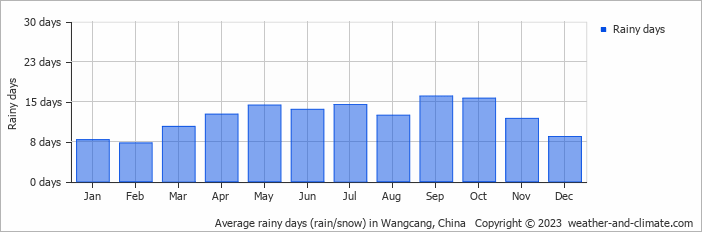
- Most rainy days are in September and October.
- On average, September is the most rainy with 16 days of rain/snow.
- On average, February is the driest month with 7 rainy days.
- The average annual number of rainy days is 144.
Current rainfall in Wangcang
Fri Nov 15
21°C | 11°C
SE  4 km/h
4 km/hbroken clouds and no rain
Sat Nov 16
14°C | 9°C
N 14 km/h
14 km/h4 mm
overcast and rain
Sun Nov 17
11°C | 8°C
N 7 km/h
7 km/h9 mm
overcast and heavy rain


