ClimateForecastMayJune >>

Average monthly rainy days in Vinstra

The number of days each month with rain, snow and hail in Vinstra (Oppland), Norway.

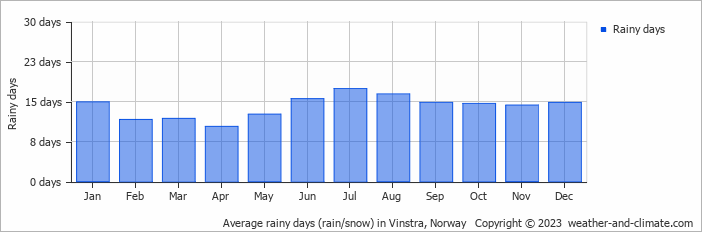
  • Most rainy days are in June, July and August.
  • On average, July is the most rainy with 17 days of rain/snow.
  • On average, April is the driest month with 10 rainy days.
  • The average annual number of rainy days is 168.

Forecast for Vinstra

Tue   May 28
20°C | 13°C
S 11 km/h
2.7 mm
broken clouds and small chance of slight rain

broken clouds and small chance of slight rain

Wed   May 29
16°C | 11°C
SE 11 km/h
8 mm
overcast and heavy rain

overcast and heavy rain

Thu   May 30
18°C | 9°C
SE 11 km/h
broken clouds and no rain

broken clouds and no rain

Interested in more climate information?

This site provides you with all the information you need about the climate in Vinstra.

Our site offers climate and forecast data for every country in the world. Are you going to Norway? On this website you can find historical weather averages for many cities in Norway. Not sure yet where to go? We now have a tool which recommends destinations that suit your ideal climate conditions. Find out where to go with our weather planner.