Monthly Average Rainy days in Vĩnh Long
The number of days each month with rain, snow and hail in Vĩnh Long (Vinh Long), Vietnam.
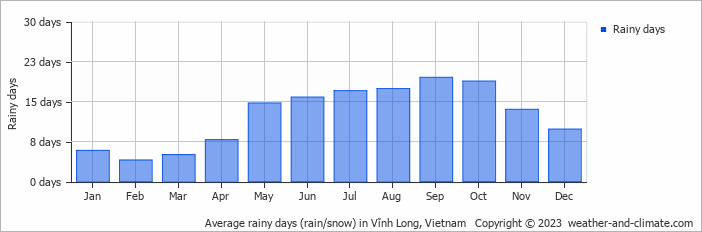
- Most rainy days are in June, July, August, September and October.
- On average, September is the most rainy with 19 days of rain/snow.
- On average, February is the driest month with 4 rainy days.
- The average annual number of rainy days is 148.
Current rainfall in Vĩnh Long
Tue Dec 03
28°C | 25°C
SE  7 km/h
7 km/h40 mm
overcast and heavy rain
Wed Dec 04
29°C | 24°C
N 7 km/h
7 km/h15 mm
broken clouds and thunder
Thu Dec 05
31°C | 24°C
E 11 km/h
11 km/h4.4 mm
partly cloudy and thunder


