Monthly Average Rainy days in Unterschächen
The number of days each month with rain, snow and hail in Unterschächen (Uri), Switzerland.
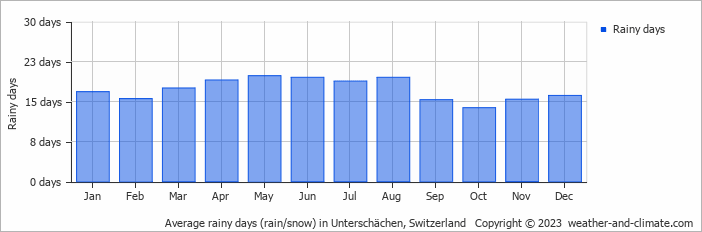
- Most rainy days are in January, February, March, April, May, June, July, August, September, November and December.
- On average, May is the most rainy with 19 days of rain/snow.
- On average, October is the driest month with 13 rainy days.
- The average annual number of rainy days is 207.
Current rainfall in Unterschächen
Wed Jan 15
1°C | -7°C
E  1 m/s
1 m/s
1 m/spartly cloudy and no rain
Thu Jan 16
-2°C | -8°C
SE 3 m/s
3 m/salmost clear and no rain
Fri Jan 17
-2°C | -11°C
SE 2 m/s
2 m/sclear and no rain