Average Rainy - Precipitation days in Trnava
With 141 days and 700 mm of annual rain/snow, Trnava has a moderate precipitation pattern. On this page, you can learn everything about the number of precipitation days.
Monthly Distribution of Rainy Days
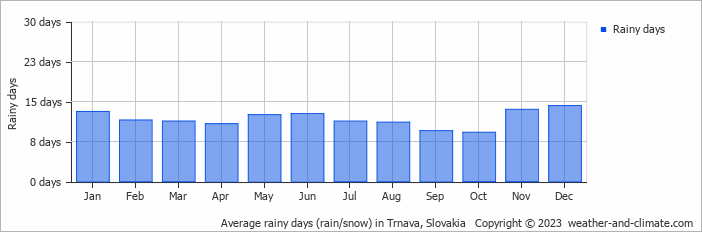
The wettest month is July, with 11 rainy days bringing 81 mm of rain. In contrast, February sees 12 snowy/rainy days with 42 mm of snow/rain.
Amsterdam Precipitation Days Compared World Wide
On average, Trnava receives over 141 days of precipitation annually. For comparison, here is some data from popular tourist destinations around the world:In Cairo, Egypt, there are only about 16 precipitation days annually, making it one of the driest capitals in the world.
Singapore, Singapore, records about 175 precipitation days per year, with rain spread fairly evenly throughout the year.
In Athens, Greece, it rains around 70 days in the year; therefore, it is one of the driest Mediterranean cities, mainly dominated by winter rainfall.
Every year, the city of New York, USA, records about 130 precipitation days, with rainfall evenly distributed throughout the year.
Osaka, Japan, experiences 198 precipitation days annually, with wetter summers compared to winter.
Adelaide, Australia, records about 86 precipitation days per year, with dry summers and wet winters.
Rain Facts From Around the Globe
Here are some amazing facts about rain and precipitation worldwide:
- Cherrapunji, India, records an average of 322 rainy days each year. Despite this, the wettest place is Mount Waialeale in Hawaii with 11500 mm annual rainfall.
- The fastest recorded raindrop fell at 18 meters per second during a thunderstorm in Brazil.
- The Atacama Desert in Chile is so dry that some weather stations have never recorded rainfall since their installation.
- The largest recorded raindrop measured 8.8 mm in diameter during a tropical storm on La Réunion Island.
- Some clouds can weigh up to 500,000 tons, that's equivalent to the weight of 100 elephants.
For more detailed information about rainfall patterns in Trnava, visit our Rainfall & Precipitation page.


